Rising housing costs in Vancouver: New evidence from the Census

Vancouver’s housing affordability crisis is full of jaw-dropping anecdotes about home prices and rents. But with almost a million households in Metro Vancouver, there are both winners and losers from the boom. A recent Statistics Canada release on housing affordability from the 2016 Census allows us to put some numbers to the crisis.
Almost two-thirds (64%) of Metro Vancouver households are owners, and most of them (38% of households) are owners with mortgages, but a substantial group (25% of households) are owners without a mortgage.
Just over a third of households (36%) are renters. The vast majority live in market rental stock while a small share (5% of households) live in subsidized housing, which includes various forms of social and co-op housing as well as those receiving rent supplements.
The share of households in subsidized housing is woefully low when compared to other advanced countries. Still, they and many others in purpose-built rental stock (most of which was built decades ago) have manageable monthly shelter costs. In contrast, secondary suites and rented condos are the sources of more recent additions to rental stock. They are associated with the problems we’ve seen in the rental market such as renovictions and fixed-term leases. Unfortunately, the data do not break out this sub-group.
For owners and renters, there are breakdowns on how much each is paying per month as a total shelter cost. For renters, shelter cost is rent plus basic utilities (electricity, heat, water) whereas for owners it is mortgage payments, property taxes, condo fees and utilities.
Almost one in six Metro Vancouver households is paying more than half of their income just to keep a roof over their heads.
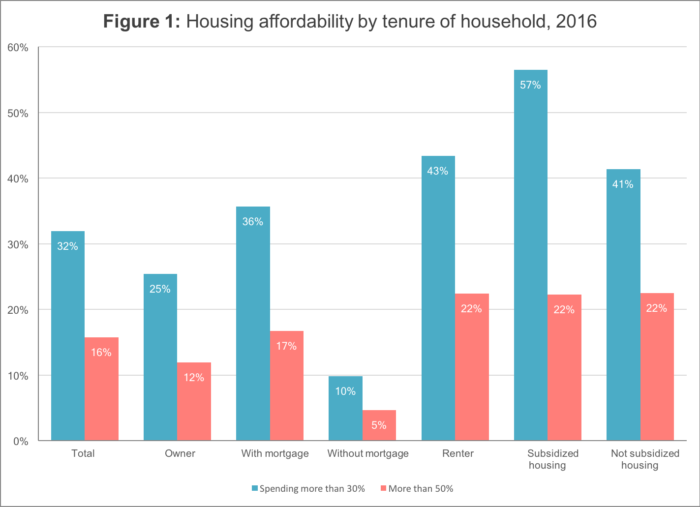
A common metric for housing affordability is whether a household is paying more than 30% of its income in shelter costs. By this standard, fully one-third of households (32%) are in unaffordable housing situations. Half of that group (16% of households) are paying more than 50% of income in shelter costs.
Put another way, almost one in six Metro Vancouver households (150,430 households) is paying more than half of its income just to keep a roof over their heads.
Figure 1 shows housing affordability for all households and within each group. For renters, the numbers are worse. More than two in five (43%) pay more than 30% of income for their housing, and for those in subsidized rental housing (who are likely to have lower incomes), the figure rises to 57%. Across all renters, 22% are paying more than half their income in shelter costs.
For owners, the story is more nuanced. As would be expected, households without mortgages are in a much better position with only 10% of this group paying more than 30% of income in shelter costs.
For those with mortgages, the share jumps to 36% paying more than 30% of income in shelter costs. A caution is that some share of mortgage payments represents reducing the principal on the mortgage itself. This portion is savings, essentially putting money in your own pocket. Unfortunately the data do not break out the share of mortgage payments paying interest to the bank or credit union.

Source: 2016 Census
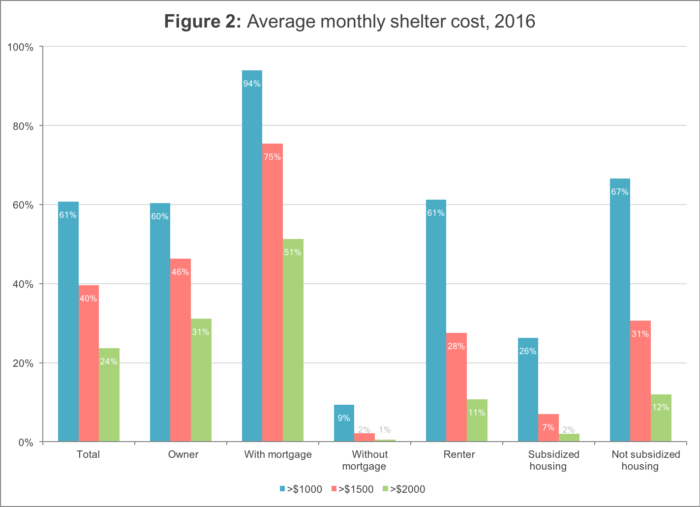
The census data also allow us to put dollar figures on shelter cost (you can play with the data yourself here). I regrouped the data to focus on the share of households that pay more than $1,000 per month, more than $1,500 per month, and more than $2,000 per month. Figure 2 below shows how things break out for Metro Vancouver households.

Source: Author’s calculations based on 2016 Census
It’s not surprising that 61% of households pay more than $1,000 in monthly shelter costs. But it’s striking that one in four (24%) pay more than $2,000 per month. As expected, housing is totally a non-issue for owners without mortgages. Indeed, 76% of owners without mortgages paid less than $750 per month (not shown). For those with mortgages, more than half paid more that $2,000 a month.
On the rental side, those in subsidized housing fared much better than those in market housing. Only 2% paid more than $2,000 and only 7% more than $1,500. More than half paid less than $750 and 74% less than $1000 per month (not shown).
For market rental, we start to see the impact of soaring rents. Two-thirds pay more than $1,000 per month, 31% more than $1,500, and 12% more than $2,000. It’s worth noting that these numbers reflect many renter households who are long-time tenants insulated by rent controls. For people seeking to find a place to rent, on the other hand, low vacancy rates have driven rents way up.
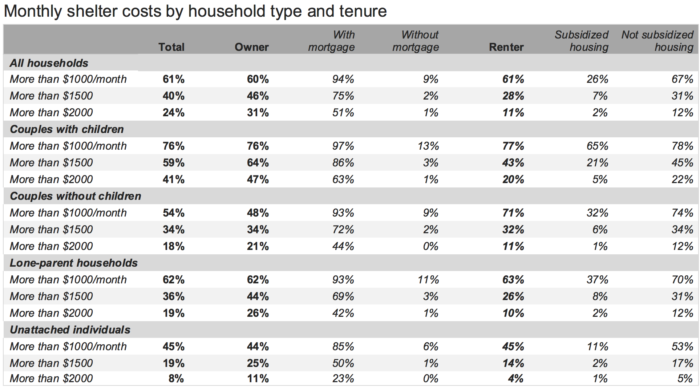
While these data are for all households, household type matters: a two-income household with three kids is going to need way more space and therefore pay more rent and other costs than a single individual. At the bottom of this piece I break out monthly housing costs for these different household types, but for each group we see the same overall pattern as all households taken together.
There are also some changes in tenure patterns across different household types. Just over half (52%) of single people and 43% of lone-parent households are renters compared to just 26% for couples (with or without kids). Put another way, couples are much more likely to be owners: 71% of those without kids and 77% of those with kids are owners.
The biggest affordability challenge in Metro Vancouver is clearly for renters.
So where you stand on housing depends on where you sit. If you are among the one in four who own their home outright, you have a security of tenure that won’t generate media headlines and you are also the beneficiary of the huge increase in home prices. Others with mortgages have manageable costs relative to income, but a small portion are vulnerable to an interest rate hike or an economic downturn that leads to a job loss or some other shock.
The biggest affordability challenge in Metro Vancouver is clearly for renters, which highlights the need for greatly expanding the city’s dedicated rental housing stock and in particular various forms of social and cooperative housing.
It’s also worth noting that rent paid by renters is someone’s income. This is also true for mortgage interest paid to the bank. The two together are what economists call the economic rent from real estate. And the data clearly show that a large portion of the income earned by Vancouver households is lining the pockets of owners (known as “rentiers” in economics). This points to the need for a more managed and regulated housing supply that matches the needs of households who live and work in the city, and ultimately creating more democratic ownership of the city’s housing.

Source: Author’s calculations based on 2016 Census
Topics: Housing & homelessness


